Analytics Architecture
The previous articles covered individual components: stream processors, materialized views, time-series storage. How do these pieces fit together into working systems?
Different analytics requirements call for different architectures. A simple operational dashboard needs different infrastructure than a business intelligence platform supporting ad-hoc queries. This article covers three common patterns and when to use each.
Pattern 1: Stream to Cache
The simplest architecture for real-time dashboards. Events flow through a stream processor that writes aggregates to an in-memory cache. Dashboards read from the cache.
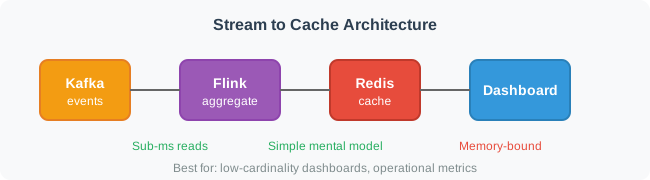

The flow:
- Events publish to a message broker (e.g., Kafka)
- Stream processor aggregates by window and dimension
- Results write to Redis with TTL-based expiration
- Dashboard fetches from Redis on refresh
Why does this work well for simple cases? The stream processor handles the computation. Redis handles serving. Neither is doing work outside its specialty.
Example: An operational dashboard shows request counts and error rates per minute, broken down by service. The stream processor computes (service, minute) → count aggregates. Redis stores them. Dashboard queries typically complete in single-digit milliseconds.
Trade-offs:
The approach has clear limits. Redis is memory-bound—all data must fit in RAM. High-cardinality dimensions (user-level metrics, millions of distinct values) exhaust memory quickly. And you can only query what you pre-computed. A product manager asks "what's the 95th percentile latency by region and device type?" If you didn't pre-aggregate that combination, there's no answer without reprocessing.
Best for: Low-cardinality operational dashboards, simple aggregations, teams wanting minimal infrastructure complexity.
Pattern 2: Time-Series Database
For metrics-focused workloads with more dimensions than fit in memory, a time-series database provides purpose-built storage.
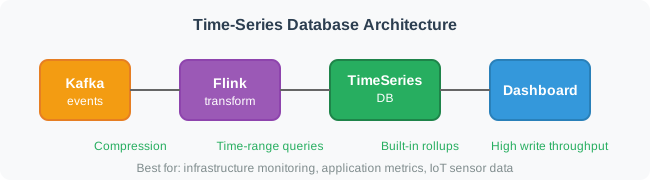
The flow:
- Events publish to the message broker
- Stream processor computes aggregates
- Results write to a time-series database (InfluxDB, TimescaleDB)
- Dashboard queries the database
Time-series databases optimize for this specific pattern. They compress timestamped data efficiently—often roughly 10-20x better than general-purpose databases for this workload, though the exact ratio depends on the data and access pattern. Query languages are designed for time ranges: "show me CPU usage for the last hour" is a native operation. Built-in rollup and retention policies handle the patterns from the previous article automatically.
Trade-offs:
Time-series databases handle more dimensions than Redis because they store data on disk. But they're less flexible than general SQL. Complex joins, arbitrary aggregations, and ad-hoc exploration are harder. And it's another system to operate—monitoring, backup, capacity planning.
Best for: Infrastructure monitoring, application metrics, IoT sensor data—workloads where queries follow predictable patterns around time ranges and a fixed set of dimensions.
Pattern 3: Hybrid (Hot + Cold)
What if you need both real-time dashboards and ad-hoc exploration? Serve two audiences with two systems.
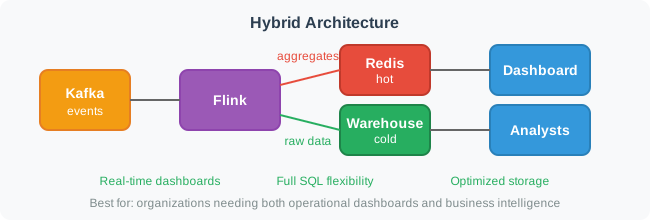
The flow:
- Stream processor reads from the message broker
- Hot path: Writes aggregates to Redis for live dashboards
- Cold path: Writes raw or lightly aggregated data to a data warehouse
- Operational dashboards query Redis for instant results
- Analysts query the warehouse for exploration
This separates concerns cleanly. The hot path optimizes for latency—pre-computed aggregates, in-memory storage, single-digit-millisecond reads. The cold path optimizes for flexibility—raw data preserved, full SQL available, any question answerable (given enough query time).
Trade-offs:
Two systems means more operational overhead. Hot and cold paths may temporarily disagree—data lands in Redis before reaching the warehouse, or vice versa. This eventual consistency is usually acceptable for analytics, but you should show "as of" timestamps on dashboards and run periodic reconciliation to catch drift.
Best for: Organizations needing both operational monitoring (SRE dashboards) and business analytics (conversion funnels, cohort analysis).
Choosing an Architecture
Start simple. The stream-to-cache pattern handles many use cases with minimal infrastructure. Add complexity only when requirements demand it.
| Requirement | Architecture |
|---|---|
| Simple dashboards, few dimensions | Stream to Cache |
| Metrics-heavy, many dimensions, predictable queries | Time-Series DB |
| Both real-time dashboards and ad-hoc analysis | Hybrid |
A common evolution: start with stream-to-cache for operational metrics. When analysts need historical exploration, add the cold path to a warehouse. The hot path continues serving dashboards. You've grown into the hybrid pattern organically.
Practical Considerations
Late data. Dashboards tolerate some staleness. Don't block showing results while waiting for stragglers. Display "as of" timestamps so users know data freshness. Most operational decisions don't require perfect accuracy—"roughly 500 errors per minute" is actionable.
Hot-cold consistency. The hot path might show 1,234 requests for 10:00-10:05. The cold path might show 1,241 for the same window once late data arrives. This is fine for most analytics. If you need exact consistency, you need a single path—which means either delayed hot-path results or limited cold-path flexibility.
Cardinality management. Limit dimensions in the hot path. Per-user metrics for millions of users don't fit in Redis. Keep high-cardinality analysis in the warehouse where storage is cheaper and query time is acceptable.
Section Summary
This section covered data processing from fundamentals to production patterns:
- Batch processing with Unix pipelines, MapReduce, and Spark
- Stream processing with windowing, event time, and delivery guarantees
- Hybrid architectures combining batch and stream (Lambda, Kappa, unified frameworks)
- Data pipelines with ETL/ELT, backfill strategies, and error handling
- Real-time analytics with materialized views, time-series patterns, and serving architectures
These patterns compose. A production system might use CDC to stream database changes, Flink for stream processing, Redis for hot dashboards, and a data warehouse for historical analysis. Choose components based on your specific latency, flexibility, and operational requirements.