Introduction to Probabilistic Data Structures
Probabilistic data structures trade exact answers for large efficiency gains, enabling approximate queries on datasets too large for traditional exact methods. Sketches such as Count-Min Sketch and HyperLogLog use fixed space for a chosen configuration; structures such as Bloom filters must be sized for their expected capacity to maintain a target error rate.
Probabilistic Data Structures are essential for tackling Top K Heavy Hitter, Realtime Monitoring System, and Design Rate Limiter.
The Scalability Problem
Traditional data structures fail at internet scale. A HashSet storing 1 billion unique user IDs requires on the order of tens of GB of memory, depending on ID size and per-entry overhead. Counting distinct page views across billions of events becomes impossible with exact methods.
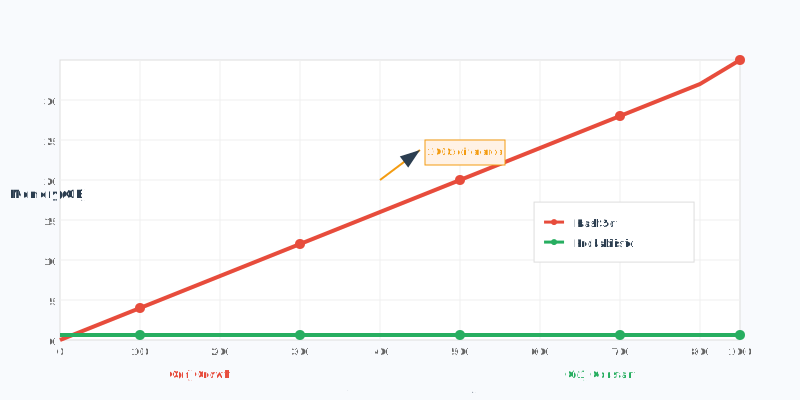
Memory grows linearly with data size. As datasets reach petabyte scale, exact counting requires proportional memory. This creates fundamental limits on what systems can process in real-time.
Approximate answers are often sufficient. Business decisions rarely require exact counts - knowing there are "approximately 50 million unique users" versus exactly "49,847,293 users" doesn't change strategic choices.
Core Principles
Controlled randomness enables compression. Probabilistic structures use hash functions and statistical properties to compress information about large datasets into fixed-size summaries.
Error bounds are mathematically predictable. Unlike heuristics, these structures provide precise guarantees about accuracy. You can configure them to achieve specific error rates (e.g., 1% error with 99% confidence).
One-pass processing supports streaming data. Elements are processed once as they arrive, making these structures ideal for real-time analytics and systems that can't store entire datasets.
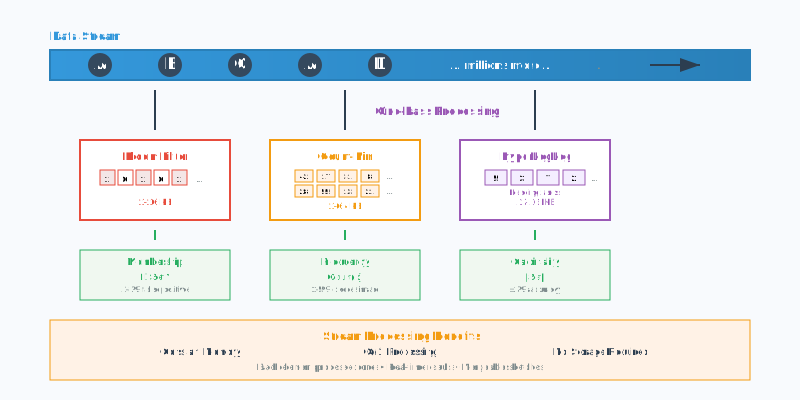

This streaming approach enables real-time analytics where each incoming event immediately updates relevant probabilistic sketches, providing instant feedback without requiring storage or batch processing.
Memory and Performance Trade-offs
Deterministic structures scale poorly. Traditional approaches require O(n) memory where n is the number of unique elements. Binary trees, hash tables, and arrays all face this fundamental limitation.
Many probabilistic structures use near-constant space. A HyperLogLog uses the same ~12KB whether counting 1,000 or 1 billion distinct elements — its memory is independent of cardinality. (A Bloom filter is different: it must be sized up front for its expected element count to hold a target false-positive rate, so it does grow with capacity.)
Processing time is usually fixed per operation for a chosen configuration. For example, a Bloom filter performs O(k) hashes and a Count-Min Sketch touches O(d) counters. Treating k or d as configured constants makes this independent of the number of elements already processed, though merging or enumerating a sketch can take time proportional to its configured size.
Error rates decrease with more memory. Unlike fixed trade-offs, you can invest more memory to achieve higher accuracy, providing flexible engineering choices.
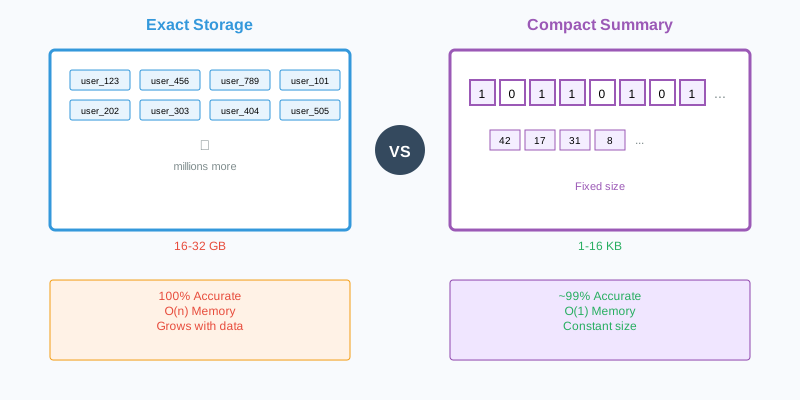
The fundamental difference lies in the approach: deterministic structures store every element individually, while probabilistic structures create compact summaries that capture essential statistical properties of the dataset.
Use Cases and Applications
Probabilistic data structures shine in scenarios where the dataset is vast, and exact answers are either impossible or impractical to obtain.
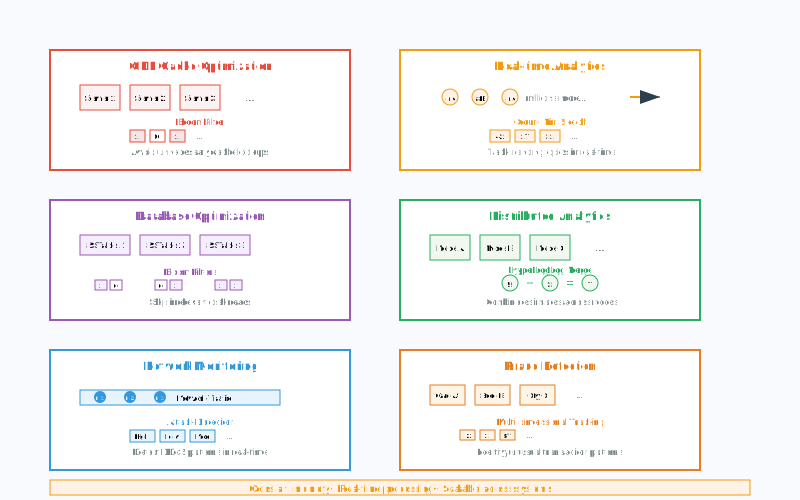
CDN Cache Optimization
Problem: CDNs need to check if content exists in cache before expensive origin server requests. Storing URLs for millions of cached objects requires excessive memory.
Solution: Bloom filters provide fast negative lookups. If the filter says "not present," skip the cache check entirely. False positives only trigger unnecessary cache lookups, not incorrect behavior.
Production impact: Akamai uses Bloom filters to avoid caching "one-hit-wonders" (content accessed only once), freeing up 75% of their cache storage while maintaining optimal performance for frequently accessed content.
Real-time Analytics at Scale
Problem: Track frequency of millions of events (page views, API calls, user actions) in real-time without storing individual event records.
Solution: Count-Min Sketch maintains frequency estimates in constant memory. Can process billions of events while using only kilobytes of storage.
Production example: Social media platforms use Count-Min Sketch to track trending topics in real-time, processing millions of events per second with sub-linear memory usage to identify viral content as it emerges.
Common Patterns and Applications
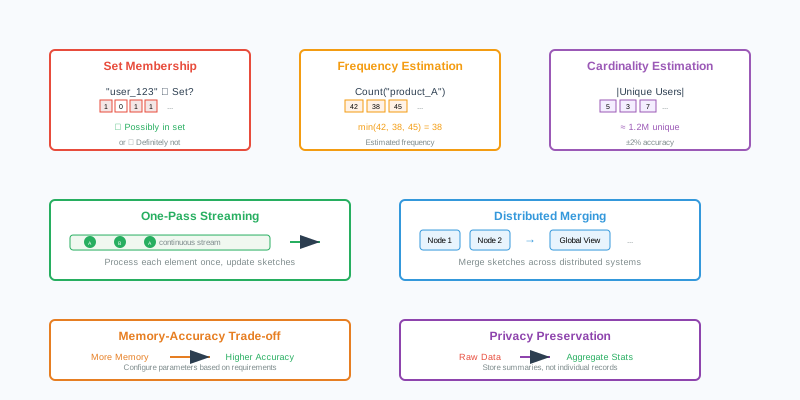
Set membership testing (Bloom filters): "Have I seen this user before?" "Is this email address in our blocklist?" Perfect for avoiding expensive database lookups when the answer is likely "no."
Cardinality estimation (HyperLogLog): "How many unique visitors did we have today?" "How many distinct error types occurred?" Enables real-time analytics dashboards without storing individual records.
Frequency estimation (Count-Min Sketch): "Which products are trending?" "What are the top API endpoints by request count?" Supports top-K queries and anomaly detection.
Distributed aggregation: All these structures support merging across multiple machines, enabling scalable distributed analytics without complex coordination protocols.
When to Use Probabilistic Structures
Large-scale streaming data where exact counting is impossible due to memory constraints. Real-time analytics, monitoring systems, and event processing pipelines.
Distributed systems requiring aggregation across multiple nodes. The ability to merge sketches makes distributed analytics much simpler than coordinating exact counts.
Performance-critical applications where sub-millisecond response times matter more than perfect accuracy. Cache systems, load balancers, and real-time recommendation engines.
Privacy-sensitive scenarios where storing individual records creates compliance risks. Aggregate analytics without retaining personal data.
The important question is recognizing when approximate answers are sufficient for business needs. Most analytics and monitoring use cases fall into this category.