Design a Realtime Monitoring System
Functional Requirements
- The system should continuously monitor data from a fleet of servers.
- The data to be collected includes CPU usage, memory usage, disk usage, system logs, and web server access and error logs.
- Users should be able to set alert rules based on certain conditions. For example, if the average CPU usage in the last 5 minutes exceeds 80%, an alert should be triggered.
- Alerts should be delivered to users via email, SMS, or push notifications within 1 minute of being triggered.
- Users should be able to view real-time and historical data on a web-based dashboard.
Non-Functional Requirements
- Scalability: The system should initially support monitoring 10,000 servers, with the capacity to scale by 20% annually.
- Reliability: The system should accurately collect and process server data, and reliably deliver alerts.
- Availability: The system should be operational 24/7 to ensure continuous monitoring and alerting.
- Consistency: the required guarantee differs by data type. Metric ingestion is eventually consistent — a write becomes visible to readers after a short delay rather than immediately — because each metric passes through the ingestion queue before it can be read. Alert rules and server metadata are read-mostly configuration and need read-after-write consistency, meaning a reader always sees its own most recent write, so a rule change takes effect promptly. Dashboards read recent metrics and may lag ingestion slightly. Replicated metric data is strongly consistent — every reader sees the latest write immediately — within a data center, and eventually consistent across data centers (see Database Replication).
- Latency: The system should process and display data in real-time or near real-time.
- Efficiency: The system should efficiently handle high volumes of data and alert rules.
Resource Estimation
Assuming each metric is submitted every 10 seconds (submitted 8640 times per day), and each server has 6 metrics.
Assuming the read-write ratio is 1:100.
Assuming each metric is 100 bytes.
-
Writes Per Second: 10,000 servers / 10s * 6 = 6,000 RPS
The number 6 here represents 1 time for CPU, 1 time for memory, 1 time for disk usage, 1 time for system log, 1 time for web server access log, and 1 time for web server error log.
-
Reads Per Second: 6,000 RPS / 100 = 60 RPS
-
Storage: each server writes 6 metrics every 10 seconds, so 6 × 8,640 = 51,840 writes per server per day. Across 10,000 servers at 100 bytes per write, retained for 60 months (~31 days each):
10,000 servers × 51,840 writes/server/day × 100 bytes × 31 days × 60 months ≈ 88TB.
Use the resource estimator to calculate.
API Endpoint Design
We will install an agent on each server, which can collect data and send it back to a central server. The main API for the main server to accept new data entries:
- POST /api/data:
The request body includes the server ID, timestamp, and data, as below:
The response includes the status of the data entry, as below:
{ "server_id": String, "timestamp": Timestamp, "data": { // data } }Other components like dashboard, alerts and rules engine also need their APIs, but they are standard CRUD APIs tailored to the frontend, so we omit them here.{ "status": String }
High-Level Design
The detailed design below builds the system up one component at a time, each motivated by the requirement it satisfies. The composed architecture and end-to-end flow are shown after the components are developed.
Detailed Design
Components in the System
-
Servers with Agents
The Monitoring Agent should be installed on servers that require monitoring to gather key metrics such as CPU usage, memory usage, system logs, and web server logs. This agent is designed to be lightweight, ensuring minimal impact on the system's performance. These agents must be reliable, resilient (capable of handling temporary network disruptions), and secure.
In terms of system hardware metrics like CPU usage and memory usage, we can gather this data at regular intervals, for example, every 10 seconds. This data is then sent to the Realtime Monitoring System service. The data collection interval shouldn't be too short, because the collection process itself consumes CPU cycles. If collection occurs too frequently, it consumes resources and degrades the performance of the monitored server.
When it comes to system logs and web server logs, we can keep track of their log files. Whenever these files are modified, the updated content is sent to the Realtime Monitoring System service.
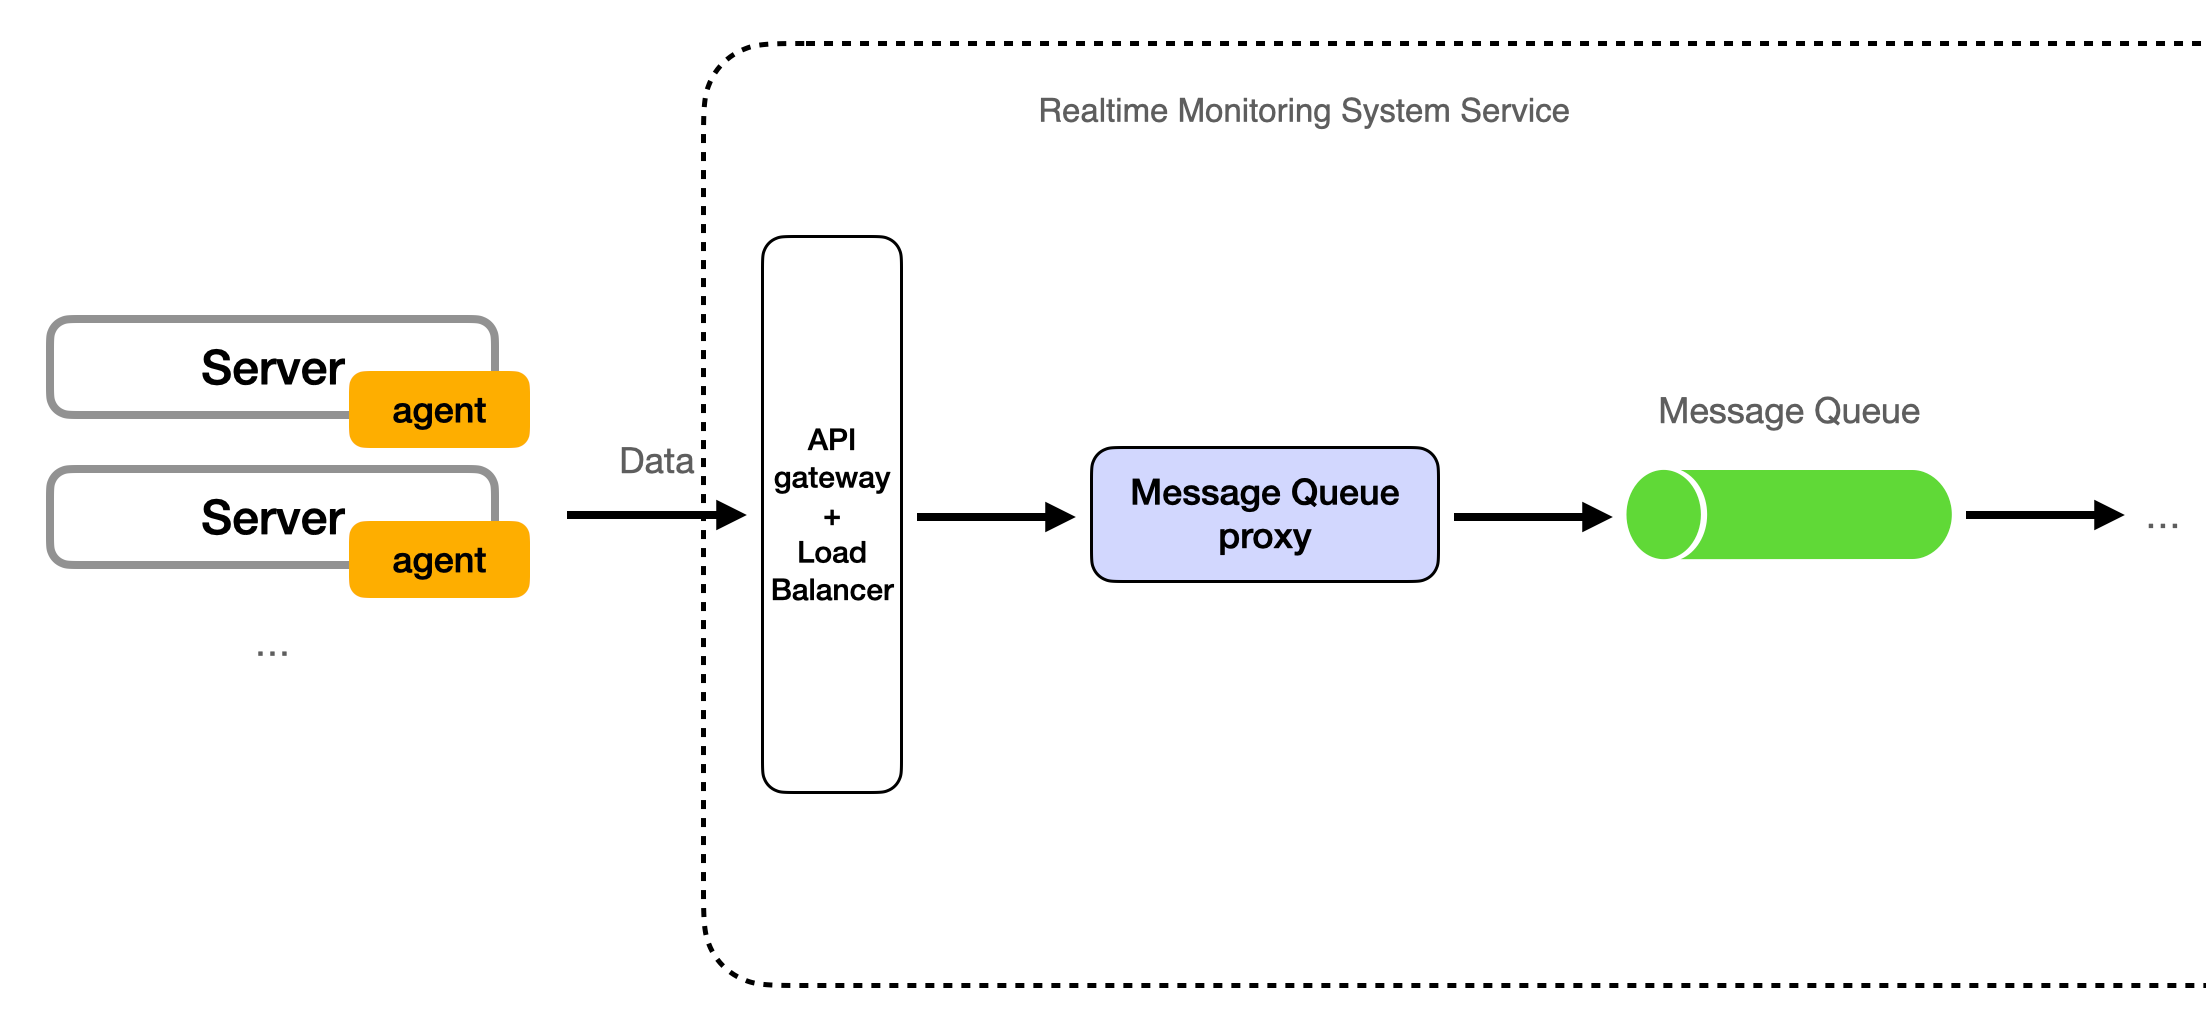
Metrics from the agents land in a message queue — the data ingestion system (Kafka or RabbitMQ), developed in the next section — which buffers incoming writes and decouples the agents from downstream processing. A Message Queue Proxy sits between the agents and that queue: agents send their metrics to the proxy, and the proxy writes them into the queue, so agents never connect to the queue directly. This keeps the agents simple and lets the proxy handle authentication, batching, and back-pressure. Back-pressure is how the proxy reacts when downstream capacity — the queue or the processors — is running out: it slows the rate at which it accepts agent writes, briefly buffers them, and, if the buffer fills, rejects or drops the excess so the overload does not propagate into the pipeline.
The Monitoring Agent therefore only transmits data to the proxy; it doesn't write into the message queue itself. The relationship between the Monitoring Agent, the proxy, and the queue is shown below:

Push or Pull
The preceding segment explains the process of transmitting metrics data from the agent to the server, with the explanation based on the design principle of the push method. However, an alternative method, known as the pull method, could also be utilized. In the pull method, the Message Queue Proxy proactively retrieves data from the agent. Below is a comparative illustration:
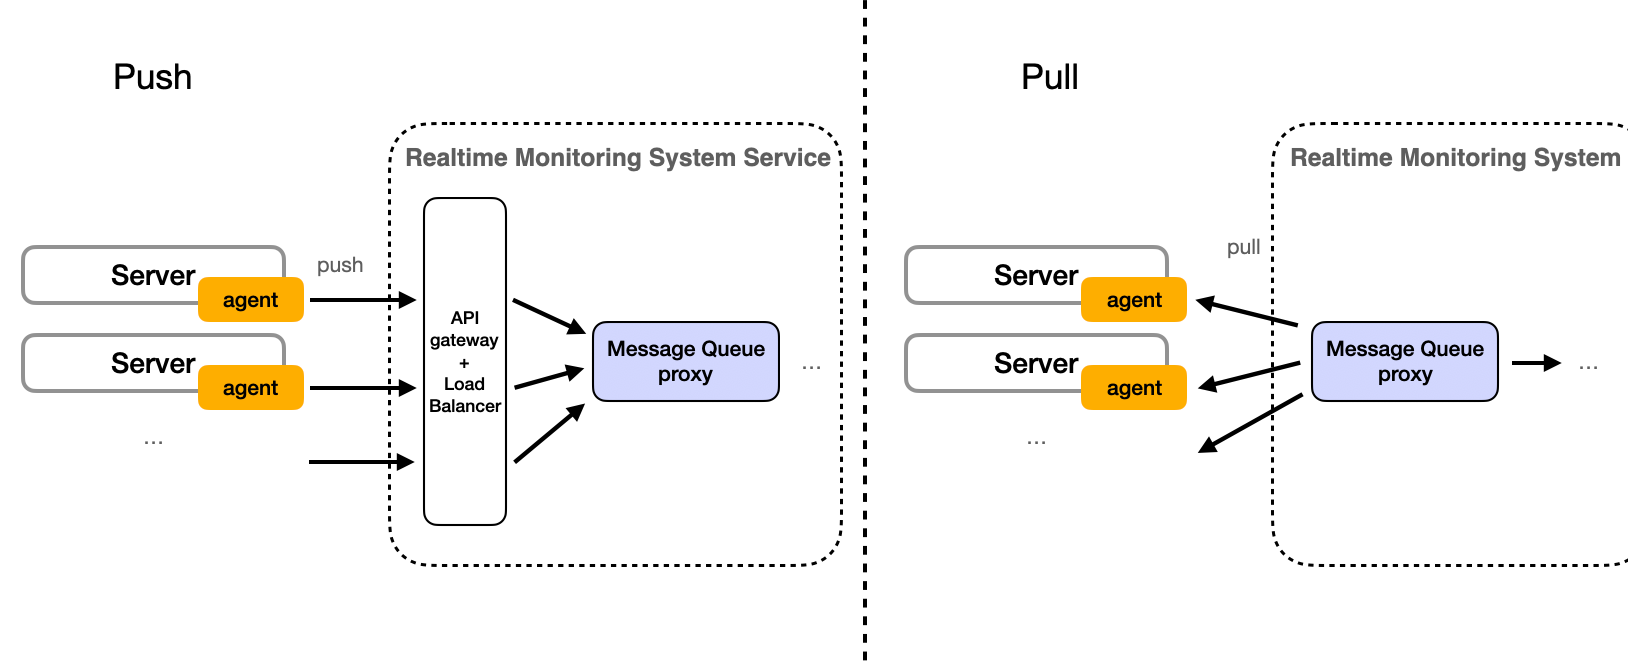
The following table compares the advantages and disadvantages of push and pull:
Push System Pull System Advantages 1. Real-time data delivery. 2. Efficient for large, infrequent data. 1. On-demand data transfer. 2. Receiver has control. Disadvantages 1. Potential for data overload. 2. Less flexibility for receiver. 1. Not real-time. 2. Can be inefficient for large, infrequent data. See Push vs Pull for more detail.
Considering the requirement for instantaneous data and the high concurrency support provided by our Data Ingestion System, the push method could potentially be the more effective design for this system.
-
Data Ingestion System (Kafka/RabbitMQ)
The role of the data ingestion system is to ingest the incoming metric writes — about 6,000 writes per second from 10,000 servers, per the estimate above — and distribute that data to multiple consumers.
Apache Kafka and RabbitMQ are distributed streaming platforms suited to this. They handle real-time data feeds with low latency and high throughput, and store and process streams of records in a fault-tolerant way.
Writing data directly to a time-series database (TSDB) — a database optimized for storing and querying timestamped data points — is an alternative. The first thing to consider is whether a TSDB can meet our writes per second needs. Taking InfluxDB as an example, below are the write per second and query per second data for the database cluster given by the official InfluxDB document:
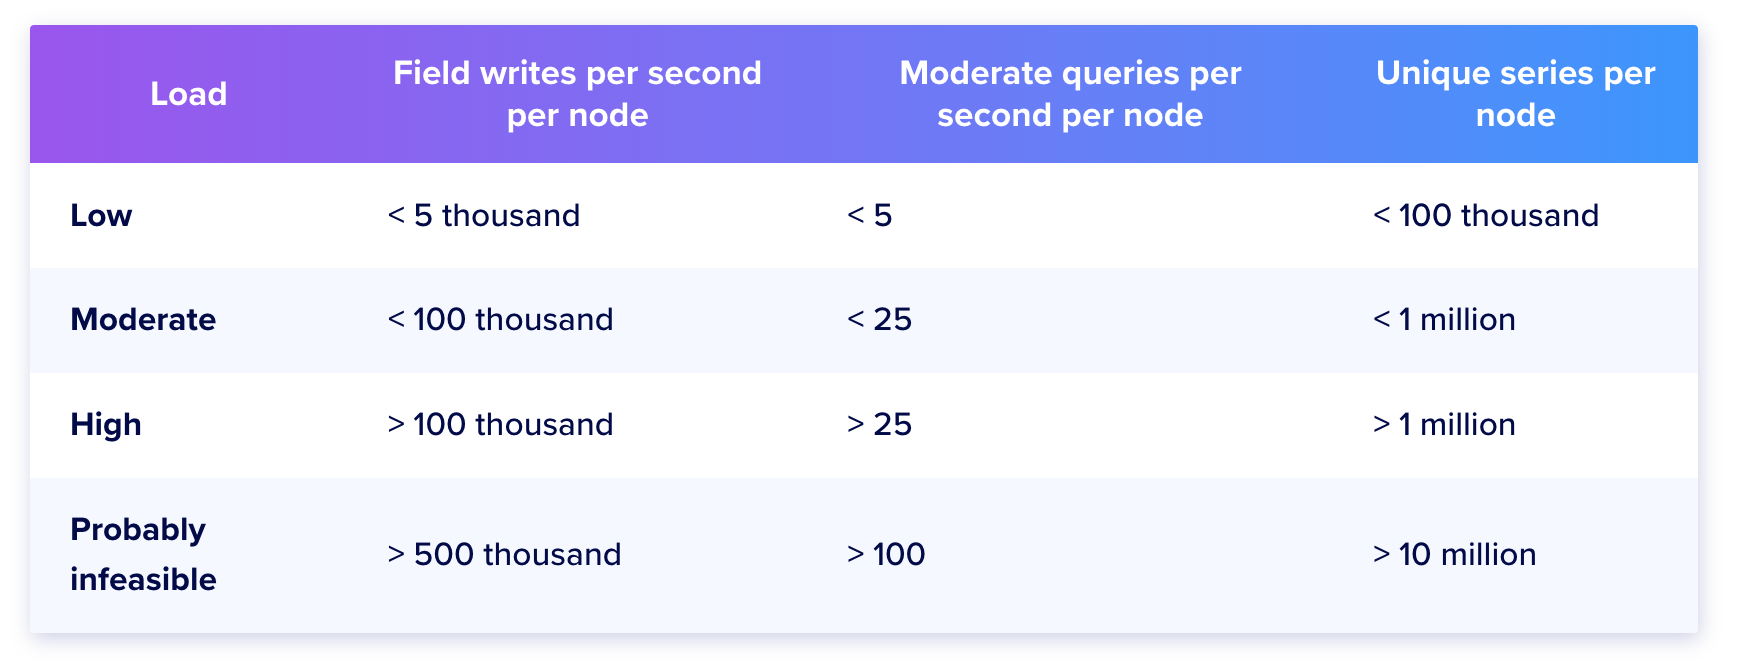
And the recommended hardware for various loads:
CPU(cores) RAM(GB) IOPS Low load 2 2-4 1000 Moderate load 4-6 8-32 1000+ High load 8+ 32+ 1000+ From the above, utilizing the InfluxDB cluster, the fields write per second typically ranges from 5k–100k. That limit is counted in fields per second, but our 6,000 estimate from the Resource Estimation section is requests per second, and each request writes several fields. The two units must be reconciled before comparing.
For example, if each write carries 5 fields on average, then 6,000 writes/sec × 5 fields = 30,000 fields/sec. That sits inside InfluxDB's cited 5k–100k range, but with little headroom: a peak of several times the average would approach or exceed the 100k limit. (The 5-fields figure is illustrative; the real count depends on the schema.)
Traffic may be unevenly distributed; there will be periods of high and low activity. Peak loads, which could be several times the average, are likely to surpass the 100k limit of InfluxDB. Given the database's high server performance requirements, it's costly and inefficient to manage peak loads by enhancing a single database server's performance or by expanding the database cluster.
As a result, opting to write to Kafka/RabbitMQ instead of directly to the database is an effective strategy for managing peak loads and database downtime. The queue absorbs bursts that exceed the database's write rate and drains them at a pace the cluster can sustain — bounded by the queue's own retention and disk capacity. If a burst outlasts that capacity, the oldest buffered writes are dropped, so the queue smooths spikes rather than removing the underlying capacity limit.
For information on Kafka's Writes Per Second data, refer to this article: Benchmarking Apache Kafka: 2 Million Writes Per Second (On Three Cheap Machines).
To summarize the advantages of introducing a Data Ingestion System (Kafka/RabbitMQ):
- Fault tolerance: while the database is down, writes are buffered in the queue and consumed once it recovers. Durability depends on the queue's replication and retention — data survives as long as the outage stays within the retention window;
- Lower cost to handle higher peaks;
- Provides the possibility for the next stage, the Stream Processing System (Flink/Storm) — which reads the ingested stream and computes aggregates and alert evaluations in real time (detailed in the next section).
There are also disadvantages:
- The complexity of the system is increased, and the maintenance cost is higher;
- The consistency of the system is reduced. (Metric data can be delayed by a few seconds before it appears in queries, which is acceptable for a monitoring dashboard.)
In conclusion, the benefits outweigh the disadvantages in this system.
-
Stream Processing System (Flink/Storm)
Analyzing data is a time-consuming task that requires significant computational resources. In some instances, exceptions may occur during the execution process. Without a Data Ingestion System like Kafka or RabbitMQ, if these tasks are performed prior to writing into a Time Series Database (TSDB), it could be challenging to ensure the system's write requests per second (rps). This underscores the importance of integrating a Data Ingestion System such as Kafka or RabbitMQ into the system for efficient data management.
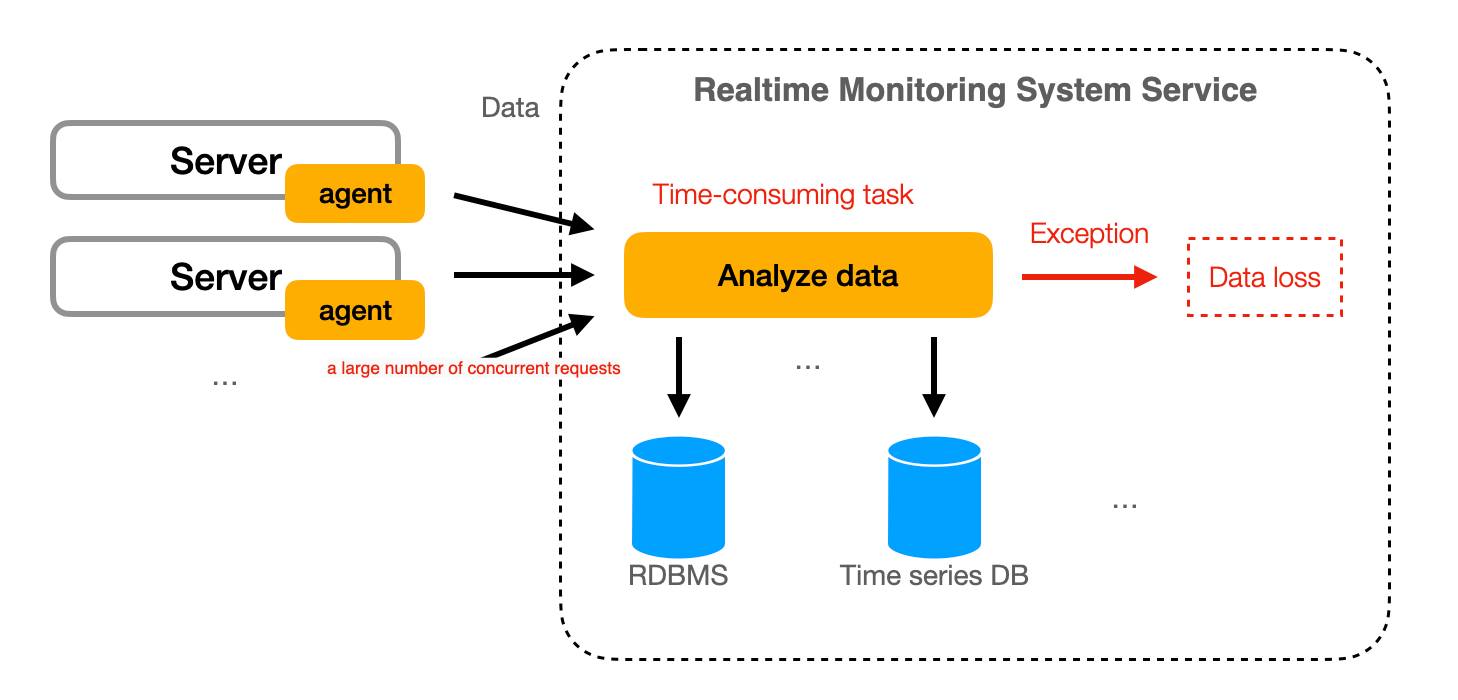
Another conceivable solution is to place data analysis and processing tasks after storage in the TSDB and trigger them through a timer. This approach has two drawbacks:
- Loading newly written data from the database wastes system performance and increases the read pressure on the database;
- Poor real-time performance. Because if the timer interval is short, queries to the TSDB will be more frequent, increasing the read pressure on the database; if the time interval is long, the real-time performance will be poor.
Stream processing reduces repeated database reads and lowers processing latency.
The stream processing system takes the ingested data and processes it in real time. It is used for real-time analytics, complex event processing, and more.
It analyzes the incoming data based on predefined alert rules. These alert rules can be set by users and may include conditions such as CPU usage exceeding a certain percentage, memory usage reaching a critical level, or specific error messages appearing in system logs.
When the stream processing system identifies data that matches these alert rules, it triggers an alert. This alert is then passed to the alert notification system for delivery to the appropriate users.
Apache Flink and Apache Storm are frameworks for big data processing and analytics. They process high-speed data streams in real time and perform event-based processing. In this architecture, this system would be responsible for triggering alerts based on predefined rules.
Refer to the stream processing section for more details.
-
Time-Series Database (InfluxDB/TimescaleDB)
The time-series database (TSDB) is used to efficiently store and retrieve time-stamped data. TSDBs like InfluxDB or TimescaleDB are designed to handle high write and query loads, and they provide capabilities like data retention policies, continuous queries, and more.
The processed data from the stream processing system is stored in the TSDB. This data is then available for queries and can be used to populate the dashboard.
-
Alert Notification System
When the stream processing system detects a condition that matches an alert rule, it triggers an alert. These alerts are then distributed to users through the alert notification system.
Meeting the one-minute delivery requirement (FR4) drives the design. The stream processor produces alerts within seconds of a threshold breach, leaving most of the budget for delivery. The notification system reads alerts from a queue and fans each one out to per-channel adapters — email, SMS, and push — so a slow channel does not block the others. Each send is retried on failure with exponential backoff: the wait before each retry doubles, so a failing channel is not hammered. The schedule is bounded to fit the one-minute budget — for example, retry after 1s, then 2s, 4s, 8s, and 16s (about 31 seconds of waiting across five attempts, plus the send times), with a little random jitter so many alerts retrying at once do not synchronize. If all attempts fail within the budget, the alert is marked failed and escalated rather than retried indefinitely. Alerts are deduplicated on a key such as
(rule_id, server_id, window)so a condition that stays breached across consecutive windows does not spam the user, and each send records a delivery state (pending, sent, failed) so undelivered alerts can be surfaced and escalated. -
Dashboard (User UI)
The dashboard serves as the user interface for the monitoring system. It retrieves data from the time-series database to display current and historical server metrics. It should provide real-time or near real-time visibility into system metrics.
The visual interface provided by the Dashboard allows us to define or modify alert rules, and we can also see the sending history of alert notifications.
Existing Solutions
There are several existing solutions that can be used for the dashboard.
Grafana: Grafana is a multi-platform open-source analytics and interactive visualization web application. It provides charts, graphs, and alerts for the web when connected to supported data sources, including InfluxDB and TimescaleDB. It is expandable through a plug-in system and can create, explore, and share dashboards across a team.
Kibana: Kibana is an open-source data visualization and exploration tool used for log and time-series analytics, application monitoring, and operational intelligence use cases. It offers histograms, line graphs, pie charts, heat maps, and built-in geospatial support. Also, it provides tight integration with Elasticsearch, a popular analytics and search engine, which makes Kibana the default choice for visualizing data stored in Elasticsearch.
Chronograf: Chronograf is InfluxData’s open-source web application. It displays data stored in InfluxDB and supports building queries and alerts. It includes templates and libraries for building dashboards with real-time visualizations and for creating alerting and automation rules.
-
Batch Processing System (e.g., Apache Spark)
A major characteristic of time-series data in monitoring systems is that while the volume of data is large, access to the data is concentrated on the most recent data. Historical data, such as data from a week or a month ago, is rarely accessed. However, the vast amount of data occupies valuable database storage space. Therefore, the preservation of historical data is an issue that monitoring systems must consider. Measures that can be adopted include:
- Aggregating historical data, transforming data with high time granularity into data with lower granularity, thereby reducing the quantity of historical data;
- Using storage media with lower costs to store historical data.
The batch processing system reads data from the TSDB in batches (for example, every hour). It processes and aggregates the data, and then writes the processed data to a long-term storage system. Apache Spark is a popular framework for big data processing and analytics, and it's designed to handle batch processing efficiently.
See Batch processing for more detail.
-
Long-Term Storage (e.g., Hadoop/HDFS, Amazon S3, Google Cloud Storage)
This is where processed, batch data is stored for the long term. It should be scalable and cost-effective, and support the queries and analyses the system runs over historical data.
Comparing Storage Costs: InfluxDB Cloud Serverless vs. Amazon S3
The following is an updated version of the InfluxDB Cloud Serverless Pricing Table as of August 2023:

The pricing table indicates that the cost for Storage is priced at $0.002 per GB-hour, which approximately equates to $1.44 per GB-month. In comparison, the Amazon S3 Pricing as of the same period (August 2023) stands at roughly $0.023 per GB. The storage costs between these two platforms show a significant difference, with a ratio of about 60:1. Therefore, moving historical data to long-term storage reduces storage cost.
Composed Architecture
With the components defined, the composed architecture and the interaction between services look like this:
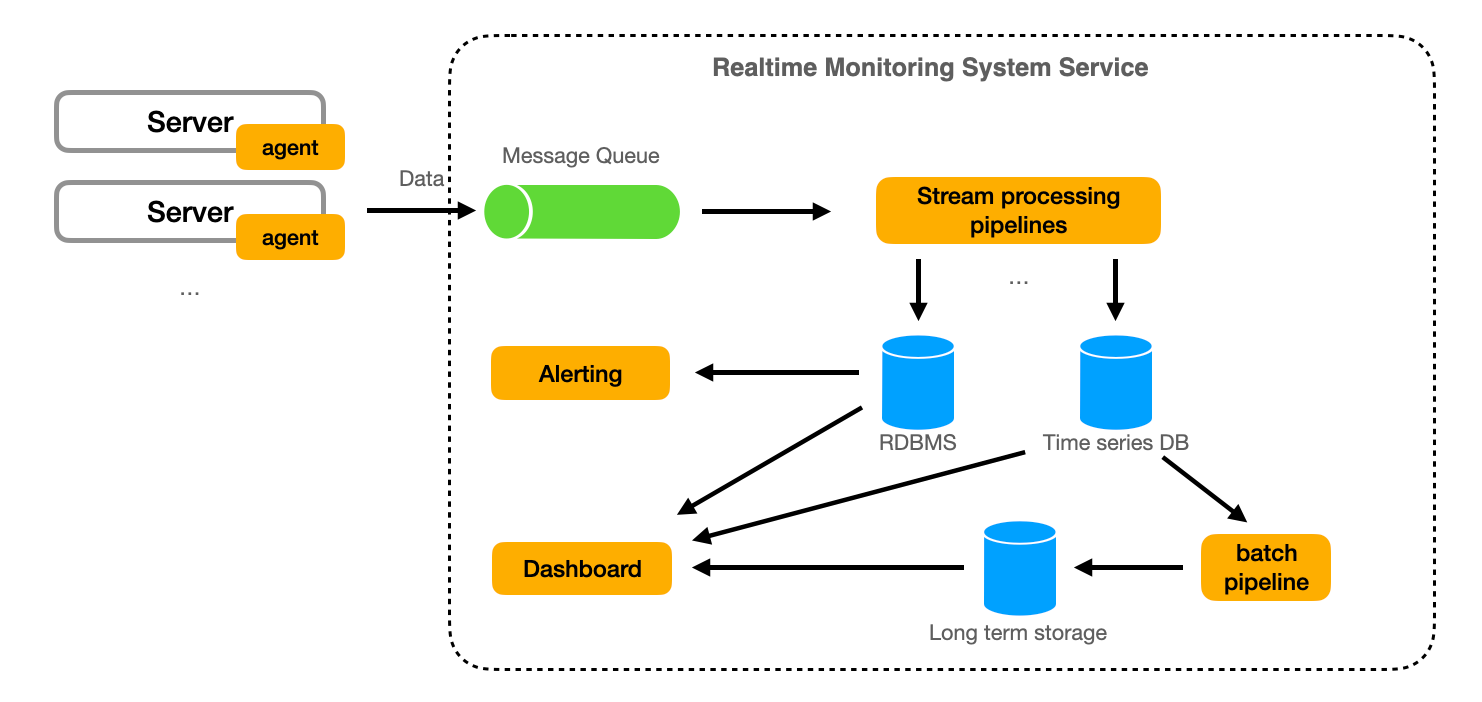
End to end: the server agents collect data and send it to the data ingestion system, which distributes it to the stream processing system. The stream processing system processes the data in real-time, triggers alerts based on user-defined rules, and stores the processed data in the time-series database. The alert notification system delivers alerts to users, and the dashboard displays real-time and historical data.
Data Store
Database Type
A time-series database (InfluxDB/TimescaleDB) is used to efficiently store and retrieve time-stamped server data.
A relational database is used to store alert rules, notifications, metadata of monitored servers, and some configuration information of the dashboard, etc.
Data Schema
Server Data (Saved to TSDB):
time(timestamp): The time the data point was recorded.server_id(string): Identifier of the server from which the data originated.cpu_usage(float): The CPU usage of the server at the recorded time.memory_usage(float): The memory usage of the server at the recorded time.disk_usage(float): The disk usage of the server at the recorded time.system_logs(float): The network traffic on the server at the recorded time.access_logs(text): Any access logs recorded at the time.error_logs(text): Any error logs recorded at the time.
Alerts Table (RDBMS):
alert_id(string): Unique identifier for each alert.server_id(string): Identifier of the server associated with the alert.rule_id(string): Identifier of the rule that triggered the alert.time(timestamp): The time the alert was generated.status(string): Status of the alert (e.g., "open", "acknowledged", "closed").
Rules Table (RDBMS):
rule_id(string): Unique identifier for each rule.rule_name(string): Name of the rule.rule_condition(string): The condition under which the rule triggers an alert.
Servers Table (RDBMS):
server_id(string): Unique identifier for each server.server_name(string): Name of the server.
Database Partitioning
To handle the large amount of data and high write load, we can partition the data in our time-series database. Partitioning can be done based on time or server_id. Time-based partitioning is a common strategy in time-series databases, where data is partitioned into time intervals (e.g., hourly, daily). This makes it easy to drop old data and helps with the performance of time-based queries. Server-based partitioning can help distribute the write load across multiple nodes and can improve query performance if we often query data for specific servers.
Database Replication
Replication keeps a copy of the data on more than one node so the system survives a node failure. The choice between synchronous and asynchronous replication is a trade-off between write latency and how much recent data a failure can lose.
With synchronous replication, the primary forwards each write to the replica and waits for the replica's acknowledgment before it acknowledges the client. Consider a write at t=0: the primary sends it to the replica, the replica persists it and acks, and only then does the client see success. If the primary crashes right after the client's success, the replica already holds the write, so the acknowledged write survives this primary-node failure — but every write pays the round-trip latency to the replica.
With asynchronous replication, the primary acknowledges the client immediately and forwards the write to the replica in the background. The gap between the two is replication lag. Consider a primary that acks at t=0 and replicates at t=0+50ms: if it crashes at t=20ms, the writes in that 20ms lag window never reached the replica and are lost. Writes are fast, but a crash within the lag window loses the most recent data.
This is why we use synchronous replication within a data center — the round trip to a replica is sub-millisecond, so durability adds sub-millisecond replication latency within the data center — and asynchronous replication across data centers, where a round trip of tens of milliseconds is too slow to block every write, accepting a small, bounded loss window in exchange.
Data Retention and Cleanup
Given the large volume of data, we need to have a data retention policy. We can keep detailed data for a short period (e.g., one week) and then aggregate the data for long-term storage. For example, we can keep hourly averages for up to a month, daily averages for up to a year, and so on. Old data can be deleted or archived to cheaper storage. This can be done as a background job running at off-peak hours to minimize the impact on system performance.
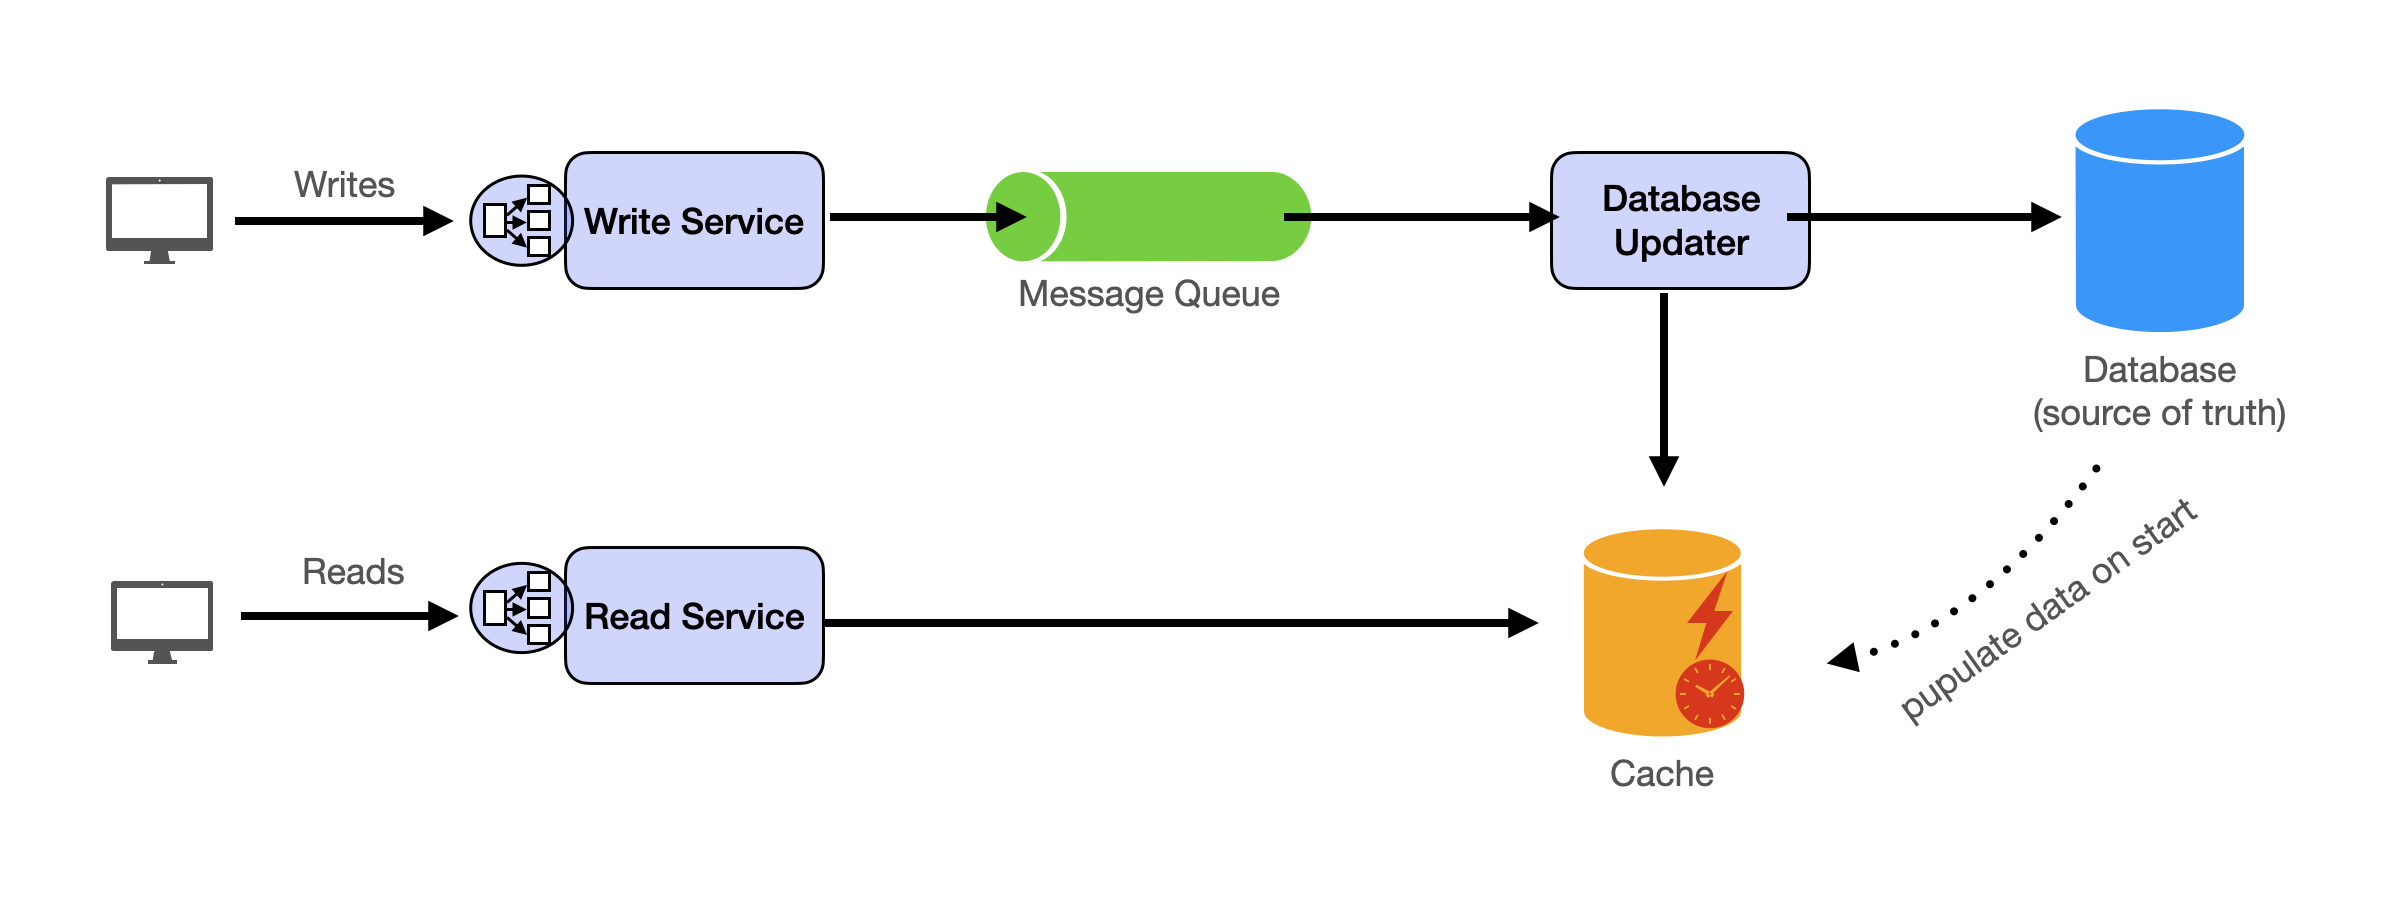
Cache
Caching can be used to improve the performance of read-heavy operations. For example, we can cache server metadata and alert rules since these are likely to be accessed frequently. We can use an in-memory cache like Redis or Memcached for this purpose. The cache should have a suitable eviction policy (e.g., LRU) to ensure that the most frequently accessed data is kept in the cache.
We can also cache the results of frequent and expensive queries. Caching expensive queries can significantly improve the performance of the system by reducing the load on the database and decreasing the response time for these queries.
In the real-time monitoring system, once data for a specific time frame has been collected and processed, its results are stable in the common case, because recorded metrics are immutable. Late-arriving or backfilled metrics can still change a past window; when that happens, the cached result for that window must be invalidated.
For example, the average CPU usage for the last hour will remain the same once that hour has passed. Therefore, if a user frequently queries for the average CPU usage in the last hour, we can cache the result of this query and serve it directly from the cache until the next hour has passed.
This makes caching particularly effective for this type of system. By storing the results of expensive queries in a cache, we can provide faster access to this data and reduce the computational load on the system.
See Caching for more detail.
Analytics
Analytics can provide valuable insights into the system's performance and usage patterns. We can use batch processing (e.g., Apache Spark) to analyze the data and generate reports. For example, we can identify patterns in server performance, detect anomalies, and predict future trends. We can also analyze the usage of the monitoring system itself, such as the number of active users, the most common alert rules, etc. The results of these analyses can be used to improve the system and provide better service to the users.
How to strike a balance between data granularity and aggregation?
Grasping the building blocks ("the lego pieces")
This part of the guide will focus on the various components that are often used to construct a system (the building blocks), and the design templates that provide a framework for structuring these blocks.
Core Building blocks
At the bare minimum you should know the core building blocks of system design
- Scaling stateless services with load balancing
- Scaling database reads with replication and caching
- Scaling database writes with partition (aka sharding)
- Scaling data flow with message queues
System Design Template
With these building blocks, you will be able to apply our template to solve many system design problems. We will dive into the details in the Design Template section. Here’s a sneak peak:
Additional Building Blocks
Additionally, you will want to understand these concepts
- Processing large amount of data (aka “big data”) with batch and stream processing
- Particularly useful for solving data-intensive problems such as designing an analytics app
- Achieving consistency across services using distribution transaction or event sourcing
- Particularly useful for solving problems that require strict transactions such as designing financial apps
- Full text search: full-text index
- Storing data for the long term: data warehousing
On top of these, there are ad hoc knowledge you would want to know tailored to certain problems. For example, geohashing for designing location-based services like Yelp or Uber, operational transform to solve problems like designing Google Doc. You can learn these these on a case-by-case basis. System design interviews are supposed to test your general design skills and not specific knowledge.
Working through problems and building solutions using the building blocks
Finally, we have a series of practical problems for you to work through. You can find the problem in /problems. This hands-on practice will not only help you apply the principles learned but will also enhance your understanding of how to use the building blocks to construct effective solutions. The list of questions grow. We are actively adding more questions to the list.


